
Page 13 - MSDN Magazine, November 2017
P. 13
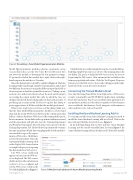
Figure 4 Visualizing a Tune Model Hyperparameters Module Model Hyperparameters module performs a parameter sweep
on a model, in this case the Two-Class Boosted Decision Tree just above the module, to determine the best parameter settings. To get an idea of what this module does, right-click on the right- hand output node and choose Visualize.
Once the dialog loads, it should be similar to Figure 4. Machine Learning Studio ran through a number of permutations and created 368 different decision trees using the different input data fields as decision points to find the optimal decision tree. Clicking on any node in a tree will reveal statistics about the node and its impact on creating the output model. The order in which the trees are displayed in the left-hand column indicate their rank in terms of producing an accurate model. Feel free to explore this dialog to get an appreciation of all the work that this module performed.
When you’re ready to proceed, close out this dialog. Make sure that the Tune Model Hyperparameters module is selected and then click the Set Up Web Service button. In the context menu that follows, click the Predictive Web Service [Recommended] option. In a few moments, the modules in the experiment will move around and the experiment will split into two tabs: Training Experiment and Predictive Experiment. The work done so far is preserved in the Training Experiment Tab. The Predictive Experiment tab contains the same trained model and data wrangling methods with modifica- tions needed to expose the experi- mentasaWebservice.ClickRunto
execute the experiment. Once the
experiment finishes running, click
on the Deploy Web Service button
to complete the process of exposing
this data model as a Web service.
Click the button to enable Sample Data on the screen that follows. Enabling Sample Data exposes a subset of the training data in the test dialog. The goal is to make the Web service easier for users to begin using the Web service. After a moment, the text fields on the form are populated with values. Click the Test Request-Response button to test the Web service. Test results will appear in the right- hand side of the screen after a few moments.
Consuming the Trained Model in Excel
Now that the trained model has been deployed as a Web service it can be consumed by any HTTP REST-capable client, including Excel 2013 and newer. Excel is an excellent client application for any predictive model, as it’s the de facto analytics tool for business users worldwide. Furthermore, Excel integrates with numerous other analytics tools, such as Power BI.
Installing the Azure Machine Learning Add-In
To consume models from Azure Machine Learning you need to install the Azure Machine Learning add-in to Excel. Click on the Insert tab and click the Store button (see Figure 6).
In the following dialog click on Store and type “Azure Machine Learning” into the search box and hit Enter. As seen in Figure 7, the Azure Machine Learning add-in is the first result. Click Add to install it.
The Web service dashboard appears on screen once the Web ser- vice is deployed. The Web service dashboard provides information on how to access, configure and test the Web service. Click on the Test link highlighted in Figure 5. msdnmagazine.com
Figure 5 Web Service Dashboard in Azure Machine Learning Studio
November 2017 9
