
Page 45 - MSDN Magazine, July 2017
P. 45
distributed environment, the L2 caches are synced across datacenters, and the L1 cache resides on the master server, as shown in Figure 4.
The challenge, then, is to define what goes in
the L1 cache, what goes in the L2 cache, and with
what frequency the regional nodes should be synced to optimize performance and storage of the cache instances. Performance of a cache is measured as “hit ratio” and “miss ratio.” The hit ratio is the fraction of accesses that are a hit (object found in cache) over all of the requests. The miss ratio is the fraction of accesses that are a miss (object not found in cache), or the remaining of the hit ratio to 100 percent.
With a mathematical formula, you can express the hit ratio as that shown in Figure 5.
The miss ratio is expressed as “1 - hit ratio.”
To optimize the performance of a cache instance, you want to increase the hit ratio and decrease the miss ratio. Irrespective of adopting an L1 or L2 cache architecture, there are different techniques for improving a cache performance, by pre-fetching data in cache on a regular basis to JIT caching, or allocation of the most used objects based on counters.
A prediction technique based on a machine learning algo- rithm is called Demand Estimation. Based on patterns of usage of objects, the Demand Estimation algorithm predicts the likelihood that an object will be used and, therefore, it can be allocated in cache before a request is submitted to increase the chance of a hit.
I’ll focus on the implementation of the Demand Estimation machine learning algorithm in the context of a data-oriented application, observing what objects are typically accessed, and populating the cache with the most used ones, as predicted by the algorithm’s outcome.
Machine Learning
Machine learning is a technique of data science that helps computers learn from existing data in order to forecast future behaviors, out- comes and trends. A machine learning system is one that uses data to make a prediction of some sort. Common techniques include logistic regression and neural network classification. Note that artificial intel- ligence (AI) is closely related, but generally refers to predictions that are associated with human behavior such as vision and speech. These predictions can make applications look
and so on), you can also drill down to the indi- vidual objects allocated over time and have better insights on the elapsing data flow of your appli- cation. But say your business is very seasonal and seasons change according to geography, and
specific campaigns might influence traffic, too. So how do you scale your cache hit estimation and create a cache of objects that are most commonlyaccessedundercertainconditions?Youimplementpre- dictive analysis and demand estimation in Azure Machine Learning.
Predictive analytics uses math formulas that analyze historical data to identify patterns of use to forecast future demand. For your machine learning model to provide predictions, the model must first learn from known data in a process known as “training.” During training, data is evaluated by the machine learning algo- rithm, which analyzes the distribution and type of data, looking for rules and patterns that can be used in later prediction.
Once the training phase is completed, “scoring” is the process of applying a trained model to new data to generate predictions. Making predictions, though, might be error-prone, also for machines. Would the predicted data have a good proportion of true results to total cases, or have high accuracy (a characteristic called “generalization”)? Or would it be consistent with the patterns identified in the historical data and give consistent results (“precision”)? You need to quality check your prediction. “Evaluation” is the QA of the scoring process.
Demand Estimation in
Azure Machine Learning Studio
Azure Machine Learning Studio is a cloud predictive analytics service that makes it possible to quickly create and deploy predictive mod- els as analytics solutions. It’s possible to work from a ready-to-use library of algorithms or start with a blank experiment, use them to create models, and deploy the predictive solution as a REST ser- vice. Azure Machine Learning Studio is available at studio.azureml.net.
The entire process, or “project” in Azure Machine Learning Studio, consists of the following:
• Importing your initial dataset; that is, the data on which the training process will be based. For our example, it’s page views over time and by region.
Figure 5 Hit Ratio
smarter. For example, when you shop online, machine learning services might recommend other products you’d like based on what you’ve already purchased. When your credit card is swiped, another machine learning service compares your transaction against a database of millions of transactions for an anomaly of behav- iors and helps detect a potential fraud.
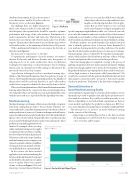
In the context of a data-oriented application, you start from analyzing the hit ratio in the implemented cache and easily identify some patterns of regular access to specific objects over a period of time, as shown in Figure 6. For each object type (Contact, Interest, Brochure
Figure 6 Cache Hits by Object Type
msdnmagazine.com
July 2017 39
