
Page 48 - MSDN Magazine, May 2017
P. 48
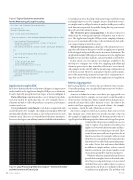
Figure 3 Typical Code Instrumentation for the Monitoring of Loop Processing
to include properties that help with monitoring, troubleshooting and analytical processes. For example, for geo-distributed services, you might want to add geolocation to analyze traffic processed by each datacenter separately. Essentially, during this step you increase the payload of the telemetry items.
The telemetry processing pipeline is the place where you define logic for reducing the amount of telemetry sent to the ser- vice. The Application Insights SDK provides sampling telemetry processors to automatically reduce collected telemetry data with- out compromising statistical accuracy.
Telemetry transmission is a final step of the telemetry process- ing where all telemetry data processed by an application is queued, batched, zipped, and periodically sent to one or more destinations. The Application Insights SDK supports transmission to the Application Insights Service and other channels, such as Event Hub, out of the box.
In this article, we concentrate on techniques available to the developer to configure out-of-the-box sampling and additional telemetry processors to fine-tune data collection to service needs. All examples in this article build the monitoring configuration in code from scratch. However, in many production environments, most of the mentioned parameters are exposed as configuration set- tings that can be fine-tuned without the application recompilation.
Metrics Aggregation
Before going further, we want to discuss telemetry type concepts. Generally speaking, you can split all telemetry into two buckets— metrics and events.
A metric is defined as a time-series data, pre-aggregated over specified intervals. For example, say you want to count the number of invocations of a function. This is a simple metric that gets incre- mented each time when call to function occurs. The value of the metrics itself gets aggregated over a period of time—for example, one minute—and at the end of that time is sent out.
An event is a single record of an occurrence that’s sent out every time. In many cases, events have very specific structure or type. In the example of Application Insights, the domain model event of a type Request has different properties than event of a type Exception.
Going back to the previous example, in case you want to capture every function execution, you might send event with function name and func- tion parameters every time it gets executed. These events let you answer all sorts of questions about function execution. For example, with raw event telemetry, you can calculate how many times this function has been called with a particular param- eter value. Notice that with more data fidelity in addition to simple analysis, such as count of function execution, you can now analyze count of execution grouped by function parameter.
While raw telemetry is much richer and lets you provide better insights, there’s a drawback relat- ed to the processing and storage costs associated with that. One way to address this is to create as many metrics up front as you think you’ll need to analyze your application. The problem with
var client = new TelemetryClient(configuration);
var iteration = 0;
var http = new HttpClient();
while (!token.IsCancellationRequested) {
using (var operation = client.StartOperation<RequestTelemetry>("Process item")) {
client.TrackEvent("IterationStarted",
properties: new Dictionary<string, string>(){{"iteration", iteration.ToString()}});
client.TrackTrace($"Iteration {iteration} started", SeverityLevel.Information);
try {
await http.GetStringAsync("http://bing.com"); }
catch (Exception exc) {
// This call will not throw client.TrackException(exc); operation.Telemetry.Success = false;
}
client.StopOperation(operation); Console.WriteLine($"Iteration {iteration}. Elapsed time:
{operation.Telemetry.Duration}"); iteration++;
} }
Application Insights SDK
In order to demonstrate these reduction techniques, it’s important to understand how the Application Insights SDK processes telemetry. It can be logically grouped into four stages, as shown in Figure 2.
Data collection is implemented as a set of telemetry modules, each responsible for particular data sets. For example, there’s a telemetry module to collect dependency, exceptions, performance counters and so on.
During telemetry enrichment, each item is augmented with useful telemetry. For example, the Application Insights SDK will automatically add the server name as one of the properties for each telemetry item. There are sets of predefined telemetry initializers; however, developers can add any number of additional initializers
Figure 4 Loop Processing Telemetry Output—Iteration Number and the Duration of Every Cycle
42 msdn magazine
DevOps
