
Page 45 - MSDN Magazine, May 2017
P. 45
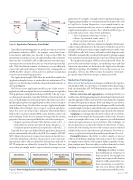
Application
Request Dependency Operation
Figure 1 Application Telemetry Data Model
Typically, for monitoring purposes, people use various service key performanceindicators(KPIs)—forexample,serviceload,trans- action latency and failure rate. In order to expose these KPIs, the monitoring system has to have an understanding of the telemetry data structure. It should be able to differentiate events that repre- sent transaction execution from, let’s say, events that represent SQL calls. With the defined semantic of telemetry, you can efficiently convert the unbound volume of telemetry into a manageable set of KPIs that’ll be cheap to collect and store, and have enough data to answer your monitoring questions.
The Application Insights SDK offers the model that enables the Application Insights Service to render effective and intuitive UI to support your monitoring, troubleshooting and analytical needs, as shown in Figure 1.
We’ll focus on two application models as part of this review— applications with an endpoint that receive external requests, typical for Web Applications, and applications that periodically “wake up” to pro- cess data stored somewhere, typical for WebJobs or Functions. In both cases, we’ll call unique execution an operation. Operation succeeds or fails through exception or it might depend on other services/storage to carry its business logic. To reflect these concepts, Application Insights SDK defines three telemetry types: request, exception and depen- dency. For every one of these types, Telemetry Data Model defines fields used to construct common KPIs–name, duration, status code and correlation. It also lets you extend every type with the custom properties. Here are some typical fields for each of the event types:
• Request (operation id, name, URL, duration, status code, [...]) • Dependencies (parent operation id, name, duration, [...]) • Exception (parent operation id, exception class, call stack, [...])
Typically, these types are defined by the application framework and are automatically collected by the SDK. For example, ASP.NET MVC defines the notion of a request execution in its model-view- controller plumbing–it defines when request starts and stops, dependency calls to SQL are defined by System.Data, and calls to HTTP endpoints are defined by System.Net. However, there are cases where you might need to expose telemetry unique to your
Figure 2 How the Application Insights SDK Processes Telemetry msdnmagazine.com
application. For example, you might want to implement diagnostics logging using a familiar-to-you instrumentation framework, such as Log4Net or System.Diagnostics, or you might want to cap- ture user interaction with your service to analyze usage patterns. Application Insights recognizes three additional data types to assist with such a need—Trace, Event and Metric:
• Trace (operation id, message, severity, [...]) • Metrics (operation id, name, value, [...])
• Event (operation id, name, user id, [...])
In addition to data collection, Application Insights will automat- ically correlate all telemetry to the operation of which it’s a part. For example, if while processing a request application you make some SQLDatabasecalls,WebServicescallsandrecordeddiagnosticsinfo, it all will be automatically correlated with request by placing a unique auto-generated operation id into the respective telemetry payload.
The Application Insights SDK has a layered model where the previously stated telemetry types, extensibility points and data reduction algorithms are defined in the Application Insights API NuGet package (bit.ly/2n48klm). To focus discussion on core principles, we’ll use this SDK to reduce the number of technolo- gy-specific data collection concepts as much as possible.
Reduction Techniques
There are four data reduction techniques available in the Applica- tion Insights SDK. As a developer, you might utilize them using a built-in extensibility API. We’ll demonstrate usage of those APIs later in this article.
Metrics extraction and aggregation is a technique that lets you locally reduce data by aggregating metrics from telemetry data and send- ing only aggregated values, instead of the events themselves. Imagine you have 100 requests per minute. If the only thing you care about is the number of requests per minute, this technique would let you locally count the number of requests and send the value once a minute, instead of sending each request and calculating counts from the raw telemetry.
Sampling is a technique that selectively collects subsets of telem- etry that lets you estimate the characteristics of the service. For most services you might collect every “n-th” request to get well-distributed statistical representation of service behavior. This technique, on the one hand, lets you reduce the volume of collection by “n” times, and on the other hand, preserves with certain accuracy statistical validity of the metrics derived from such telemetry. For better ac- curacy, a sophisticated algorithm and data model must be used.
Exemplification is the ability to collect samples of interest without invalidating sampling statistical accuracy. For example, you might want to always collect request failures regardless of sam- pling configuration. This way, while you reduce telemetry load with sampling, you can preserve useful troubleshooting data.
Filtering is the ability to reduce data by filtering out telemetry you don’t care about. For example, you might want to ignore all telemetry related to traffic generated by syn- thetic monitoring or search bots. This way, your metrics will reflect true user interaction with the service.
May 2017 39
Data Collection
Telemetry Collection Telemetry Collection Telemetry Module
Telemetry Enrichment
Telemetry Collection Telemetry Collection Telemetry Initializer
Telemetry Processing Pipeline
Telemetry Collection Telemetry Collection Telemetry Processor
Telemetry Transmission
Telemetry Collection Telemetry Collection
Channel
Trace Metric Event
Exception
