
Page 19 - Mobility Management, July 2018
P. 19
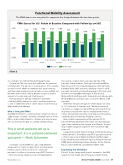
                                 Functional Mobility Assessment
The FMA item scores are paired to represent the change between the two time points.
  FMA Scores for U.S. Rehab at Baseline Compared with Follow Up (n=367)
5.45
6.00
5.22 4.00
2.59 2.00
5.40
5.43 5.46 3.54
Indoor Mobility
Baseline Follow-up
 5.19 5.19
4.88
5.14 4.83 3.38
           3.00
2.86
3.02
2.88
3.02
 2.68
3.20
          0.00
 Comfort
Health
Transfer
Daily Routine
Outdoor Mobility
Operate Personal Care
Reach
Transportation
  Chart 2
according to U.S. Rehab President Greg Packer.
A paper on FMA outcomes was published this year, but
Schmeler said, “This report is not yet research. This is quality- assurance work. VGM has members who are businesses, and they need quality-assurance metrics to be certified, just like Uber drivers need a rating. Quality-assurance metrics are part of society and part of what we do.”
Participating U.S. Rehab members have been collecting FMA numbers for years, and they use those scores to determine which clients need closer follow-up after wheelchair delivery.
Who Is Using the FMA?
The FMA information contained here came from almost 1,200 surveys of adults. (A family-centered version of the FMA can be administered to children and anyone else who would have trouble accurately self-reporting.)
This is what patients tell us is important; it is a patient-centered outcome — Mark Schmeler
Schmeler said the FMA has about 40 different diagnoses for clients to select from, but the results here focused on the top 10 most commonly reported conditions of people using CRT. The most common primary diagnosis was Stroke/Cerebral
Vascular Accident, which was reported by 17.53
percent of respondents. That was followed by Other Neuromuscular or Congenital Disease (14.9 percent); Cerebral Palsy (9.91 percent); Multiple Sclerosis (9.74 percent); Spinal Cord Injury/Paraplegia (8.55 percent); Spinal Cord Injury/Quadriplegia (5.93 percent); Osteoarthritis (4.49 percent); Amputation (3.64 percent); Morbid Obesity (3.39 percent); and Spina Bifida (2.88 percent).
After that, the percentages for other diagnoses drop to 1 to 2 percent, Schmeler said: “We know we’ve hit saturation on diagnosis. We’re 99 percent sure that the majority of people who need complex rehab have a stroke, followed by neuromuscular disease, followed by cerebral palsy, followed by multiple sclerosis.”
Respondents were evenly split by gender (51.18 percent female, 48.82 percent male), and the average age of respondents in the sample was 59 years, though respondents ranged in age from 18 to more than 100 years old.
Survey respondents listed a number of primary insurance carriers (Chart 1), from Medicare (55.75 percent, the most common response) to Medicaid, Medicare Managed Care, Private Insurance/Fee for Service, Private Insurance/ HMO, Medicaid Managed Care, Worker’s Comp, Private Pay, Vocational Rehab, and Veterans Affairs (VA).
Examining the CRT Effect
Chart 2 shows survey participants’ answers to the FMA questions that asked about the ease of performing
MobilityMgmt.com
MOBILITY MANAGEMENT | JULY 2018 17
