
Page 6 - GCN, June/july 2017
P. 6
\\\[BrieFing\\\]
Mapping neighborhood-level
health indicators
BY MATT LEONARD
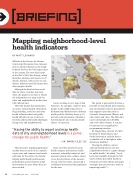
Officials at the Centers for Disease Control and Prevention have released data on chronic diseases at the neigh- borhood level for the 500 largest cities in the country. The new data is part
of the CDC’s 500 Cities Project, which identifies, analyzes and reports on 27 chronic diseases, with a focus on con- ditions, behaviors and risk factors that affect people’s health.
Although the data has been avail- able for states, counties and some cities, the project is the first to release the information on a large scale for cities and neighborhoods within cities, CDC officials said.
The hefty dataset has information on cancer, mental health, cholesterol, binge drinking, tooth loss and other health indicators that local public health officials can use to more ef- fectively address the health challenges facing cities and neighborhoods.
A user zooming in on a map of San Francisco, for example, could see that people in the neighboring cities of Richmond and Berkeley have different health profiles. Berkeley shows a 6.5 percent crude prevalence of diabetes, but Richmond’s rate is nearly double that at 11.8 percent.
The portal is powered by Socrata, a provider of cloud-based data visualiza- tion and analysis tools for government that supports open-data sites in Colorado, Pennsylvania, Illinois, and other states and cities. The CDC data can be downloaded in CSV, XML
and a few other formats. It can also be exported via an application programming interface.
Dr. Wayne Giles, director of CDC’s Division for Heart Disease and Stroke Prevention, said the data is
a valuable tool in the fight to make Americans healthier.
“Having the ability to report
and map health data at city and neighborhood levels is a game-changer for public health,” he added. “Local- level data available through the 500 Cities website \\\[provides\\\] health in- formation to better inform and target strategies that are proven to work in improving health.” •
“Having the ability to report and map health data at city and neighborhood levels is a game- changer for public health.”
The interactive mapping application enables users to zoom in on a specific census tract and compare local results with data for the entire city, thereby helping public health professionals, policymakers and researchers target interventions in areas where they are most needed.
— DR. WAYNE GILES, CDC
Users can filter datasets by state, health category (prevention, health outcomes, unhealthy behaviors) and measure (dental visits, asthma, sleep) to see the prevalence of the measure for any area they select, along with a confidence interval and the population for the area.
6 GCN JUNE/JULY 2017 • GCN.COM
CDC.GOV
