
Page 28 - FCW, September 15, 2016
P. 28
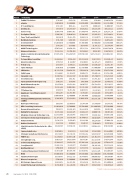
Rank Company
1 FedBiz IT Solutions
2 n2grate
3 IP Consulting Inc.
4 AveshkaInc.
5 InsersoCorp.
6 Pro-Sphere Tek Inc.
7 Favor TechConsulting LLC
8 DarkbladeSystems
9 GovernmentCIO $1,200,000
10 Pivotal Point LLC
11 AASKI Technology Inc.
12 Advanced Onion Inc.
13 Adams Communication & Engineering Technology
14 PotomacWaveConsulting
15 American Cyber Inc.
16 PretekCorp.
17 CyberStrategic
18 OBXtekInc.
19 SightComm
20 SynaptekCorp.
21 SecuriGenceLLC
22 Open Systems Technologies Corp.
23 Davis Defense Group Inc.
24 LinTech Global Inc.
25 IT Partners Inc.
26 ApplyLogic Consulting Group LLC
27 InfojiniInc.
29 Axiologic Solutions LLC
30 MBA Consulting Services Inc.
31 Research Innovations Inc.
32 HighlightTechnologies
33 Allegheny Science & Technology Corp.
34 Information Technology Strategies LLC
35 ValiantSolutions
36 Radian Solutions LLC
37 Ishpi Information Technologies Inc. (dba ISHPI)
38 Cypher Analytics Inc.
39 Strategic Operational Solutions Inc.
40 FEDITCLLC
41 StrongbridgeCorp.
42 Solutions By Design II LLC
43 CoreSphereLLC
44 DIGITALSPECLLC
45 Credence Management Solutions LLC
46 NIKA
47 TapestryTechnologies
48 Diverse Concepts Inc.
49 R3 Strategic Support Group
50 Insight Technology Solutions Inc.
$178,285
$17,073,491
$1,334,334
$15,615,889
$3,500,000
$557,013
$29,110,979
$2,706,081
$54,097,379
$7,300,000
$1,817,465
$51,131,534
$3,786,983
$165,196,298
$8,500,000
$2,475,523
$202,537,791
$7,092,015
$225,293,433
$23,000,000
$3,248,977
$289,278,670
$19,879,552
$232,062,393
109.24%
106.61%
102.88%
96.47%
96.34%
94.83%
91.79%
91.27%
90.54%
86.42%
86.03%
2011 2012 2013 2014 2015 CAGR*
$176,665 $203,318 $522,884 $576,061 $28,056,379 254.99%
$800,000 $1,200,000 $3,600,000 $28,500,000 $43,525,000 171.59%
$152,263 $166,434 $245,570 $900,029 $5,006,867 139.47%
$615,619 $5,265,087 $7,464,922 $6,494,938 $16,492,142 127.51%
$1,081,440 $4,065,862 $11,996,449 $17,648,258 $26,254,231 121.97%
$1,901,301 $3,040,569 $5,988,895 $21,912,952 $45,749,934 121.48%
$822,610 $1,834,779 $3,693,318 $11,820,771 $19,243,684 119.92%
$174,390 $209,108 $1,221,435 $3,692,452 $4,072,463 119.83%
$2,649,842 $7,184,681 $23,522,829 $29,127,233 $38,180,421
$510,528 $1,340,017 $1,920,983 $4,925,425 $6,907,623
$355,837 $1,917,454 $2,809,806 $3,506,407 $4,762,361
$550,000 $1,450,000 $2,850,000 $4,500,000 $7,250,000
$6,323,520 $29,616,593 $37,899,110 $65,438,106 $76,374,596
$1,146,661 $2,204,172 $2,804,172 $11,480,244 $13,734,209
$1,330,794 $3,943,507 $8,362,069 $15,706,135 $15,452,746 84.60%
$301,889 $741,362 $1,626,631 $3,794,822 $3,405,799
83.27%
81.99%
80.85%
80.52%
76.15%
74.15%
73.68%
69.41%
68.64%
68.62%
66.74%
65.65%
63.89%
63.61%
63.06%
62.10%
60.70%
59.96%
59.36%
59.01%
58.50%
56.54%
53.72%
52.75%
52.23%
50.18%
49.03%
48.30%
46.63%
$501,245
$2,917,929
$1,522,498
$395,818
$624,491
$1,000,000
$720,385
$3,400,000
$1,138,713
$511,046
$2,613,828
$2,002,068
$1,261,202
$2,272,936
$2,100,000
$2,007,653
$3,700,000
$3,402,401
$873,660
$9,205,735
$5,535,306
$2,001,732
$3,749,411
$4,100,000
$3,781,166
$15,700,000
$6,445,659
$2,988,377
$18,724,650
$9,015,889
$3,227,363
$5,503,778
$6,900,000
$3,516,609
$24,800,000
$829,724
$5,498,343
$31,216,355
$16,169,076
$3,811,306
$5,744,033
$9,100,000
$5,933,162
$27,500,000
$9,205,108
28 Strategy and Management Services Inc. $1,961,076 $5,424,039 $10,616,950 $13,595,336 $16,506,986 70.33% (SAMS)
28 September 15, 2016 FCW.COM
$1,315,299 $2,899,275 $3,992,237 $8,000,536 $10,165,913
$2,650,996 $6,209,788 $7,023,359 $7,929,340 $19,958,290
$2,254,239 $3,695,797 $8,890,425 $10,021,078 $16,262,801
$1,536,556 $1,370,051 $2,343,109 $6,228,409 $11,009,418
$431,739
$7,268,597
$2,076,014
$7,218,837
$317,665
$17,196,313
$1,837,221
$8,521,833
$340,517
$22,810,722
$4,131,780
$15,562,474
$2,036,913
$37,068,935
$7,265,000
$29,889,537
$3,051,924
$50,188,308
$13,846,005
$47,265,960
$5,266,925 $11,695,490 $18,082,672 $25,184,685 $33,968,778
$3,025,331 $10,129,681 $13,175,301 $14,529,836 $19,342,678
$5,964,427 $8,034,213 $15,926,489 $23,724,968 $37,644,621
$3,922,328 $3,261,577 $7,486,637 $16,381,568 $23,553,429
$750,000 $1,130,237 $1,733,576 $3,118,182 $4,188,097
$5,953,207 $15,698,818 $21,929,794 $20,541,276 $32,406,487
$7,300,000 $6,200,000 $8,500,000 $22,200,000 $39,200,000
$3,156,775 $4,422,425 $6,449,943 $10,000,927 $16,057,707
$750,000
$2,852,974
$3,519,600
$1,200,000
$4,291,202
$4,430,818
$1,890,000
$7,247,459
$7,044,771
$2,900,000
$12,755,454
$11,625,809
$3,700,000
$13,800,626
$16,267,946
*CAGR: Compound annual growth rate
