
Page 22 - Campus Technology, November/December 2017
P. 22
SALARY SURVEY
FIGURE 9
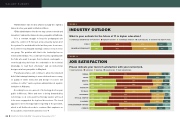
INDUSTRY OUTLOOK
What is your outlook for the future of IT in higher education?
UNBRIDLED GROWTH AND OPPORTUNITY HEALTHY GROWTH CONTINUED STABILITY SLOW DECLINE DOOM IN THE NEAR FUTURE
PUBLIC PRIVATE NOT-FOR-PROFIT
6%
10%
43%
40%
37%
10%
4%
39%
9%
2%
“Administrators have no idea what we actually do,” sighed a trainer at a four-year public institution in Illinois.
“Older administrators often do not stay current on trends and innovation,” said another trainer at a two-year public in California. “It is a constant struggle to keep the pedagogical unit under the control of IT. Not just at my university but at all of the systems I’ve worked with in the last few years. In our case, the [center for teaching and learning] continues to try to move our group. The problem with that is the leadership has no technical knowledge. You could learn much by speaking with the folks who want to acquire their technical counterparts — even though they don’t have the credentials or the technical knowledge to lead them effectively,” said an instructional
designer at a four-year public in Maryland.
“Faculty governance will continue to allow the long-held
belief that training/retraining is unneeded and unnecessary, so quality of online instruction and design of courses will continue to suffer,” said a systems administrator at a public institution in Alabama.
According to one vice provost of technology at a four-year public in Missouri, “More and more is being demanded by technology, so at some point technology leaders will need to be more engaged at the top-level discussions. The trend appears to be technology leaders reporting to the president, which in all likelihood needs to continue. But emphasis on the academic environment cannot be lost.”4
FIGURE 10
JOB SATISFACTION
Please indicate your level of satisfaction with your current job.
VERY SATISFIED SATISFIED
OVERALL SALARY BENEFITS HOURS SUPERVISOR TOP BRASS CO-WORKERS PHYSICAL COMFORT EQUIPMENT YOUR DEPARTMENT’S BUDGET COMMUTE
NEUTRAL
UNSATISFIED
VERY UNSATISFIED
24%
31%
27%
24%
22%
7%
32%
24%
22%
30%
50%
34%
50%
53%
53%
32%
19%
15%
9%
2%
1% 1%
2%
6%
8%
8%
33%
34%
34%
33%
34%
29%
45%
45%
23%
13%
10%
8%
8%
10%
9%
10%
34%
31%
5%
8%
9%
9%
19%
16%
16%
15%
16%
31%
23%
11%
6%
22
CAMPUS TECHNOLOGY | November/December 2017
