
Page 18 - Campus Technology, November/December 2017
P. 18
SALARY SURVEY
Average Salaries
The average salary in our survey, across all institution types and IT roles, was $76,874, and the median (the num- ber falling halfway between the highest and lowest salary) was $70,000. The highest salary reported was $225,000, earned by a chief technology officer at a private for-profit institution in New York. The lowest: $10,000, earned by a help desk staffer at a private for-profit in Montana. (Note: For-profit institutions made up such a low percentage of our respondents that we omitted them from all but the top-level survey results.)
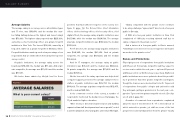
At public institutions, the average salary across the board was $76,433; the median was $71,000. And at pri- vate nonprofits, the average was $79,319 and the median was $77,951.
We broke down salaries by title/job level for those
positions that had sufficient response in the survey (see figure 2, page 19). For C-level titles (chief information officer, chief technology officer, chief security officer, chief digital officer), the average salary at public institutions was $127,166, while the median was $128,500. The average at private nonprofit institutions was $122,000; the median $125,000.
For IT directors, the average salary at public institutions was $96,332; the median $91,950. And at private nonprofits, the average was $106,000 and the median $100,000.
And for IT managers, the average salary at public institutions was $70,041 and the median was $66,000. At private nonprofits, the average was $73,631 and the median $76,500.
On the low end of the salary spectrum was help desk/ computer support personnel. The average salary for those staffers at public institutions was $59,731; the median $58,000. The average at private nonprofits was $52,475, and the median $48,500.
In the comments section of the survey, a number of respondents mentioned the budget issues that plague the IT job market in higher education:
“More money is directed toward research and building expansion than staff development and career growth,” noted a systems analyst at a four-year public university in Michigan.
“Salary competition with the private sector continues to be a big challenge,” agreed an IT director at a four-year public in Georgia.
A CIO at a two-year public institution in New York complained of “difficulty recruiting talented staff due to salary compared to the private sector.”
And a trainer at a four-year public in Illinois warned, “Unwillingness to invest in resources/expertise will lead to an exodus to the private sector.”
Raises and Promotions
Fifty-eight percent of respondents from public institutions and 67 percent from private nonprofits said they expect to receive a raise within the next year — up from 42 percent and 60 percent in our 2016 survey, respectively. Staffers at public institutions were more optimistic about the possibil- ity of promotion than their private nonprofit counterparts, though the chances were deemed low for both: 19 percent of respondents from public colleges and universities said they anticipate getting a promotion in the next year, com- pared to 7 percent from private nonprofit schools. (See fig- ures 3 and 4, page 19.)
A number of comments from respondents complained about the lack of investment in IT. “IT is the bedrock on which universities operate, yet staff are some of the last people to be acknowledged. Ever hear the phrase ‘faculty
FIGURE 1
AVERAGE SALARIES
What is your current salary?
SALARY
PUBLIC
$76,443
PRIVATE NOT-FOR-PROFIT
$79,319
18
CAMPUS TECHNOLOGY | November/December 2017
