
Page 19 - College Planning & Management, April 2018
P. 19
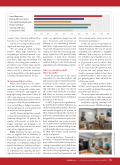
Table 1
General Maintenance Mechanical/Electrical System Technology/Networking Upgrades Furniture and Fixtures
Carpeting and Flooring Security and Life-Safety
campus. Only 23 percent indicated they have done so; 77 percent have not.
Gatewood is seeing P3 delivery mak- ing inroads into larger projects.
“We are seeing an uptick in larger projects. Many large institutions are responding to increased demand or re- placing aging facilities that very often were dense, high-capacity buildings. P3 delivery is becoming more common, es- pecially for some of these large-capacity projects where there is either state man- date to use P3 or where the institution has the demand but not the debt capacity to build a substantial project,” he says.
Maintaining What’s in Place
Where new facilities are not under- way, the looming specter of deferred maintenance, along with routine main- tenance, renovations, and upgrades are keeping housing administrators busy. In 2017, only 44 percent of survey respon- dents indicated that they had renovations in progress, while 18 percent had renova- tions on hold due to budget constraints. Thirty-eight percent of respondents had no major renovations planned.
In 2018, the percentage who respond- ed that they currently have renovations underway dropped to 25 percent. The number with projects on hold due to budget constraints also dropped, to 11 percent, while 42 percent have no major renovations/upgrades planned.
Table 1 indicates the types of renova- tions or upgrades that are underway or planned for the next three to five years. Down slightly from last year’s 96 percent, 90 percent of respondents indicate that general maintenance, painting, and repair are on the agenda. Seventy-one percent of respondents say carpeting and floor- ing replacements are necessary or in the
works—no significant change from last year’s 70 percent—and 75 percent are planning or are undertaking furniture and fixtures replacement (last year it was 72 percent). The general consensus is that students are often hard on housing; keep- ing up appearances with general/routine maintenance of walls, floors, furniture, and fixtures is a vital minimum to keep residence hall spaces safe, functional, and appealing to new and returning occupants.
What’s in a Residence Hall? What Should Be?
From the perspective of our survey respondents it’s clear that students, and their parents, expect residential facilities to provide all the comforts and ameni- ties of home... or better than home. With that said, there is no ideal, “one size fits all” cookie-cutter format for a residence hall. There are, however, common and/ or popular amenities that are included or desired across the board.
In 2017, 98 percent of respondents in- dicated that their residence hall spaces in- cluded central laundry facilities. This year, that number dropped to 88 percent. In 2017, 44 percent indicated the existence of full-service central kitchens; this year that dropped to 35 percent. In the spirit of stu- dents wanting their own version of ameni- ties, in 2017, survey respondents indicated that 47 percent of residence hall spaces do or will include kitchens in rooms or suites. In 2018, that number stayed relatively steady, at 45 percent.
Concerning kitchens, Gatewood re- ports that, “Community kitchens that are more visible and not tucked away are be- coming commonplace in new hall design. These kitchens can offer new opportuni- ties for Res Life programming, such as education around food preparation and
diet or sharing native cuisine in the case of international students.”
In 2017, 35 percent of respondents in- dicated that their residential facilities in- cluded dining halls. This year, 33 percent responded in the affirmative; a negligible difference. With a drop, too, in the num- ber of facilities reporting full-service cen- tral kitchens (from 44 percent last year to 35 percent this year) as well as a drop in the number reporting kitchen facili- ties in rooms/suites (47 percent in 2017, 45 percent this year), perhaps there is a trend to encourage students to leave their residential facilities to dine in other cam- pus gathering places. Time will tell if this will become a trend.
Coffee shops within residence halls? In 2017, only 16 percent indicated they were or would be included. That number stayed the same this year.
Classroom spaces were indicated for 33 percent of facilities in 2016; that number remains fairly steady in 2018, at 30 percent.
Inspired by ongoing, sometimes acri- monious discussion, CP&M asked again
0% 10% 20%
30% 40%
50% 60%
70% 80%
90% 100%
APRIL 2018 / COLLEGE PLANNING & MANAGEMENT 19
PHOTOS COURTESY OF RISE: A REAL ESTATE COMPANY
